Create APA Style Tables in R using the APA Tables (apaTables) Package
apaTables is an R package that you can view at the CRAN: here
apaTables documentation is provided: here
Link to the apaTables journal article in Advances in Methods and Practices in Psychological Science is provided: here
Reproducible research is research for which the numbers reported in the paper can obtained by others using the original data and analysis scripts. (Note that this differs from replicability - the extent to which findings are consistent across samples.) Recent research has revealed a problem with the reproducibility of analyses in many fields. For example, in psychology Nuijten et al. (2015) found that in 50% of articles there was at least once instance of a reported test statistic (e.g., t(24)=22.71) being inconsistent with the reported p-value. This inconsistency rate suggests there is a major problem with reproducibility in the psychological literature.
My objective in creating the apaTables package was to automate the process through which tables are created from analyses when using R. Using apaTables ensures that the tables in your manuscript are reproducible.
Although a number of table generation packages exist for R they are typically not useful for psychology researchers because of the need to report results in the style required by the American Psychological Association; that is, APA Style. Consequently, apaTablescreates Microsoft Word documents (.doc files) that contain tables that conform to APA Style.
In many cases it would be necessary to execute additional R commands to obtain all of the statistics needed for an APA Style table. For example, if conducting a regression using the lm command the unstandardized regression (i.e., b) weights are reported. Additional commands are needed to obtain standardized (i.e., beta) weights. apaTables automatically executes these additional commands to create a table with the required information in Microsoft Word .doc format1.
Additionally, the American Statistical Association recently released a position paper on the use of p-values in research. A component of that statement indicated that “Scientific conclusions and business or policy decisions should not be based only on whether a p-value passes a specific threshold.” The Executive Director of the ASA suggested that confidence intervals should be used to interpret data. This statement is consistent with the 1999 position paper from the APA Task Force on Statistical Inference. Consequently, the current version of apaTables indicates significance using stars but more importantly reports confidence intervals for the reported effect sizes.
Currently, the following tables can be created:
• Correlation tables - Correlation tables (with confidence intervals and descriptive statistics) are created from data frames using apa.cor.table.
• Single "block" regression tables - Single "block" regression tables are created from a regression object using apa.reg.table.
• Multiple "block" regression tables - Multiple "block" regression tables are created from regression objects using apa.reg.table.
• ANOVA tables - An ANOVA F-table can be created via apa.aov.table from a regression object (i.e. lm output or aov output). Cell mean/standard deviation tables for 1- and 2-way designs are created from data frames using apa.1way.table and apa.2way.table.
• ezANOVA tables from ez package - An ANOVA F-table from ezANOVA output can be created via apa.ezANOVA.table.
• Standardized mean difference (i.e., d-value) tables (with confidence intervals and descriptive statistics) illustrating all possible paired comparisons using a single independent variable are created from data frames using apa.d.table.
Bugs and feature requests can be reported at: https://github.com/dstanley4/apaTables/issues
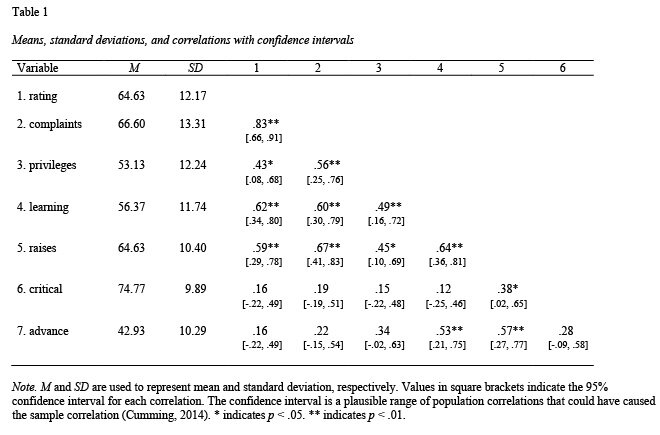
Example: Correlation table
Correlation tables can be constructed using the apa.cor.table function. The constructed table includes descriptive statistics (i.e., mean and standard deviation) for each variable and a confidence interval for each correlation.
The apa.cor.table function creates a correlation table with confidence intervals based on a data frame. The example below creates an APA Style correlation table, see Table 1, using the attitude dataset built into R.
library(apaTables)
apa.cor.table(attitude, filename="Table1_APA.doc", table.number=1)